Why Excessive CEO Pay Matters to the Rest of Us

Corporate Chief Executive Officers have done very well for themselves during and after the Great Recession. By 2015 the ratio of CEO annual compensation to that of a typical worker had risen to 276 to 1, a much higher ratio than in other developed countries. CEO compensation has gradually taken up a larger and larger share of all corporate revenues. But shouldn’t a corporation be totally free to establish the compensation of its chief executive? Actually, no. The reason is that the rest of us pay for excessive CEO compensation – literally.

Two recent studies reveal how successful CEOs at the largest U.S. corporations have been in skimming the compensation cream. The first produced by the Economic Policy institute in July 2016 dealt with CEO compensation, defined as salary, bonus, restricted stock grants, options exercised and long-term incentive payouts. It found that between 1978 and 2015, inflation-adjusted CEO compensation rose 940.9% — this was 73% faster than stock market growth for the same period. The typical worker’s annual compensation over the same period grew just 10.3%.

CEOs were spectacularly successful because of their power to direct compensation to themselves within their corporations, not because they were correspondingly more productive, more talented or better educated than other workers. This is demonstrated by the facts that between 1978 and 2015 CEO pay grew faster than corporate profits, the pay of others in the top .1% of wage earners, and the pay of college graduates in general.

U.S. tax law has also contributed to the explosion in CEO pay. A 1993 tax reform law capped the tax deductibility to corporations of executive compensation at $1 million, except that corporations could still deduct any amount of “performance-based” pay from their income taxes. What happened? You guessed it – performance based pay has been heavily adopted. The Joint Congressional Committee on Taxation estimates that closing this loophole would generate more than $50 billion in additional tax revenues over 10 years.

The second important study was produced in December 2016 by the Institute for Policy Studies. It focused on wealth inequality in retirement savings between corporate CEOs and the rest of us. Among the key findings were that the 100 top CEOs have company retirement funds worth $4.7 billion, an amount equal to the entire retirement savings of the 41% of U.S. families with the least retirement savings.

CEOs have amassed such huge retirement accounts because U.S. tax laws favor executives. If you have a 401(k) at work, you have strict limits on how much you can set aside tax-free each year. Workers 50 and older can contribute a maximum of $24,000 each year. But most CEOs of big corporations have no contribution limits because they enjoy special unlimited deferred compensation plans. In 2015 roughly half of Fortune 500 CEOs invested in these plans a total of $227 million more of their pre-tax income than if they had been subject to the same limits that apply to ordinary workers. If they had been subject to the same limits, these CEOs would have owed $90 million more in income taxes last year.

CEOs pay income tax on the money in these special plans only when they withdraw it. At present, the top income tax rate is 39.6%. President-elect Trump has proposed cutting this rate to 33%. If his proposal were enacted, CEOs who withdraw their money from the special retirement plans would avoid $196 million in income taxes.

If we have the political will we can stop this giveaway to already grossly over-compensated members of society.

National Inequality by the Numbers

Inequality of both income and wealth is a serious problem in West Virginia and the nation. This post will present some statistics about inequality in the United States that will worry anyone concerned about the future of our society.

Income inequality is different than wealth inequality. Income includes earned income like wages and salaries, as well as passive income from interest on a savings account, dividends from stock, rent, and profits from selling something for more than you paid for it. In essence, income is what a taxpayer reports on her tax return each year. Income inequality is the unequal distribution of income in the population.

Income inequality is measured on a Gini index from 0 to 1. A completely equal society in which everyone had the same income would have a Gini coefficient of 0. A completely unequal society in which one person received all the income would have a Gini coefficient of 1. More equal societies like the Scandinavian countries have Gini coefficients of .3 or below. The most unequal societies have Gini coefficients of .5 and above. Today our Gini coefficient is .47, up from .4 in 1980.

Wealth means net worth, the difference between a person’s assets and liabilities. Assets are the valuable things a person owns such as cash in a bank account, stock investments, a personal residence and retirement accounts. Liabilities are what a person owes, such as a mortgage, a car loan, a credit card balance, and so on. Wealth inequality is the unequal distribution of net worth in the population. While any measure of income inequality is a snapshot of a moment in time, wealth inequality goes beyond variations in year to year income. The United States has more pronounced wealth inequality than any other major developed nation.

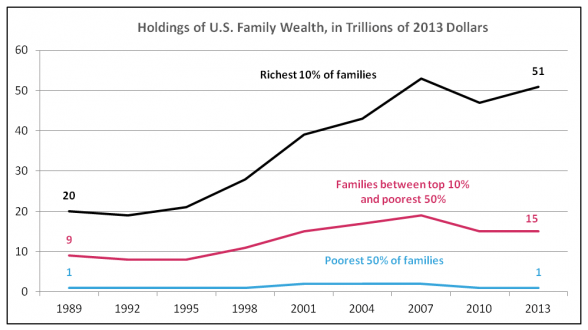
Just one statistic will demonstrate this. In his excellent book The Price of Inequality, Nobel Prize-winning economist Joseph Stiglitz observes that “the six heirs to the Wal-Mart empire command wealth of $69.7 billion, which is equivalent to the wealth of the entire bottom 30% of U.S. society.” The following graph compares the 2013 wealth of the top 10% of families with the wealth of families in the middle and bottom of U.S. society.

National Inequality

Source: Inequality.org; Congressional Budget Office, “Trends in Family Wealth, 1989-2013,” August 2016

The history of income inequality in the U.S. takes on a “U” shape when plotted over the period since 1913 when the first income tax was imposed. The top 10% of income earners enjoyed a golden period from the mid-1920s to 1940, capturing about 45% of national income. During WWII and continuing until the early 1970s, the share of the top 10% dropped and remained steady at around 32.5%. This was because of better access to education through the GI Bill and a progressive income tax. But beginning in the late 1970s the share of the top 10% began to climb. In 2012, it had reached 50.6% of income growth.

Stiglitz summarizes our current situation. Recent income growth in America has primarily been in the top 1% of earners – those in the middle and bottom are worse off than they were in 2000. In fact, the income of those in the middle have stagnated. Adjusted for inflation, the medium income for males in 2010 was $49,445, lower than it was in 1997 when this cohort received a median income of $50,123 in 2010 dollars. Our middle class has hollowed out and there is little chance that an American born in a family in the lower income brackets will ever rise to enjoy income in the higher brackets.

Income inequality in West Virginia is somewhat better than nationwide — not because we are an egalitarian state but because we are poor and have fewer people in the super-rich 1% of national income and wealth.  It is still a huge problem.