
National Inequality by the Numbers
Inequality of both income and wealth is a serious problem in West Virginia and the nation. This post will present some statistics about inequality in the United States that will worry anyone concerned about the future of our society.
Income inequality is different than wealth inequality. Income includes earned income like wages and salaries, as well as passive income from interest on a savings account, dividends from stock, rent, and profits from selling something for more than you paid for it. In essence, income is what a taxpayer reports on her tax return each year. Income inequality is the unequal distribution of income in the population.
Income inequality is measured on a Gini index from 0 to 1. A completely equal society in which everyone had the same income would have a Gini coefficient of 0. A completely unequal society in which one person received all the income would have a Gini coefficient of 1. More equal societies like the Scandinavian countries have Gini coefficients of .3 or below. The most unequal societies have Gini coefficients of .5 and above. Today our Gini coefficient is .47, up from .4 in 1980.
Wealth means net worth, the difference between a person’s assets and liabilities. Assets are the valuable things a person owns such as cash in a bank account, stock investments, a personal residence and retirement accounts. Liabilities are what a person owes, such as a mortgage, a car loan, a credit card balance, and so on. Wealth inequality is the unequal distribution of net worth in the population. While any measure of income inequality is a snapshot of a moment in time, wealth inequality goes beyond variations in year to year income. The United States has more pronounced wealth inequality than any other major developed nation.
Just one statistic will demonstrate this. In his excellent book The Price of Inequality, Nobel Prize-winning economist Joseph Stiglitz observes that “the six heirs to the Wal-Mart empire command wealth of $69.7 billion, which is equivalent to the wealth of the entire bottom 30% of U.S. society.” The following graph compares the 2013 wealth of the top 10% of families with the wealth of families in the middle and bottom of U.S. society.
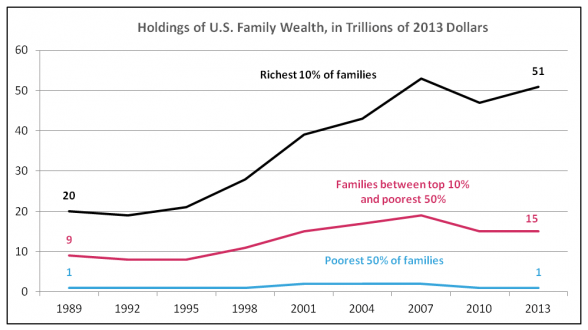
Source: Inequality.org; Congressional Budget Office, “Trends in Family Wealth, 1989-2013,” August 2016
The history of income inequality in the U.S. takes on a “U” shape when plotted over the period since 1913 when the first income tax was imposed. The top 10% of income earners enjoyed a golden period from the mid-1920s to 1940, capturing about 45% of national income. During WWII and continuing until the early 1970s, the share of the top 10% dropped and remained steady at around 32.5%. This was because of better access to education through the GI Bill and a progressive income tax. But beginning in the late 1970s the share of the top 10% began to climb. In 2012, it had reached 50.6% of income growth.
Stiglitz summarizes our current situation. Recent income growth in America has primarily been in the top 1% of earners – those in the middle and bottom are worse off than they were in 2000. In fact, the income of those in the middle have stagnated. Adjusted for inflation, the medium income for males in 2010 was $49,445, lower than it was in 1997 when this cohort received a median income of $50,123 in 2010 dollars. Our middle class has hollowed out and there is little chance that an American born in a family in the lower income brackets will ever rise to enjoy income in the higher brackets.
Income inequality in West Virginia is somewhat better than nationwide — not because we are an egalitarian state but because we are poor and have fewer people in the super-rich 1% of national income and wealth. It is still a huge problem.
